
Measure aggressive flow one candle at a time, then across the move.
Delta measures the net difference between market buying and market selling for one period. Cumulative Volume Delta, or CVD, adds those differences over time. Together they show whether aggressive execution supports price, loses efficiency or is being absorbed.
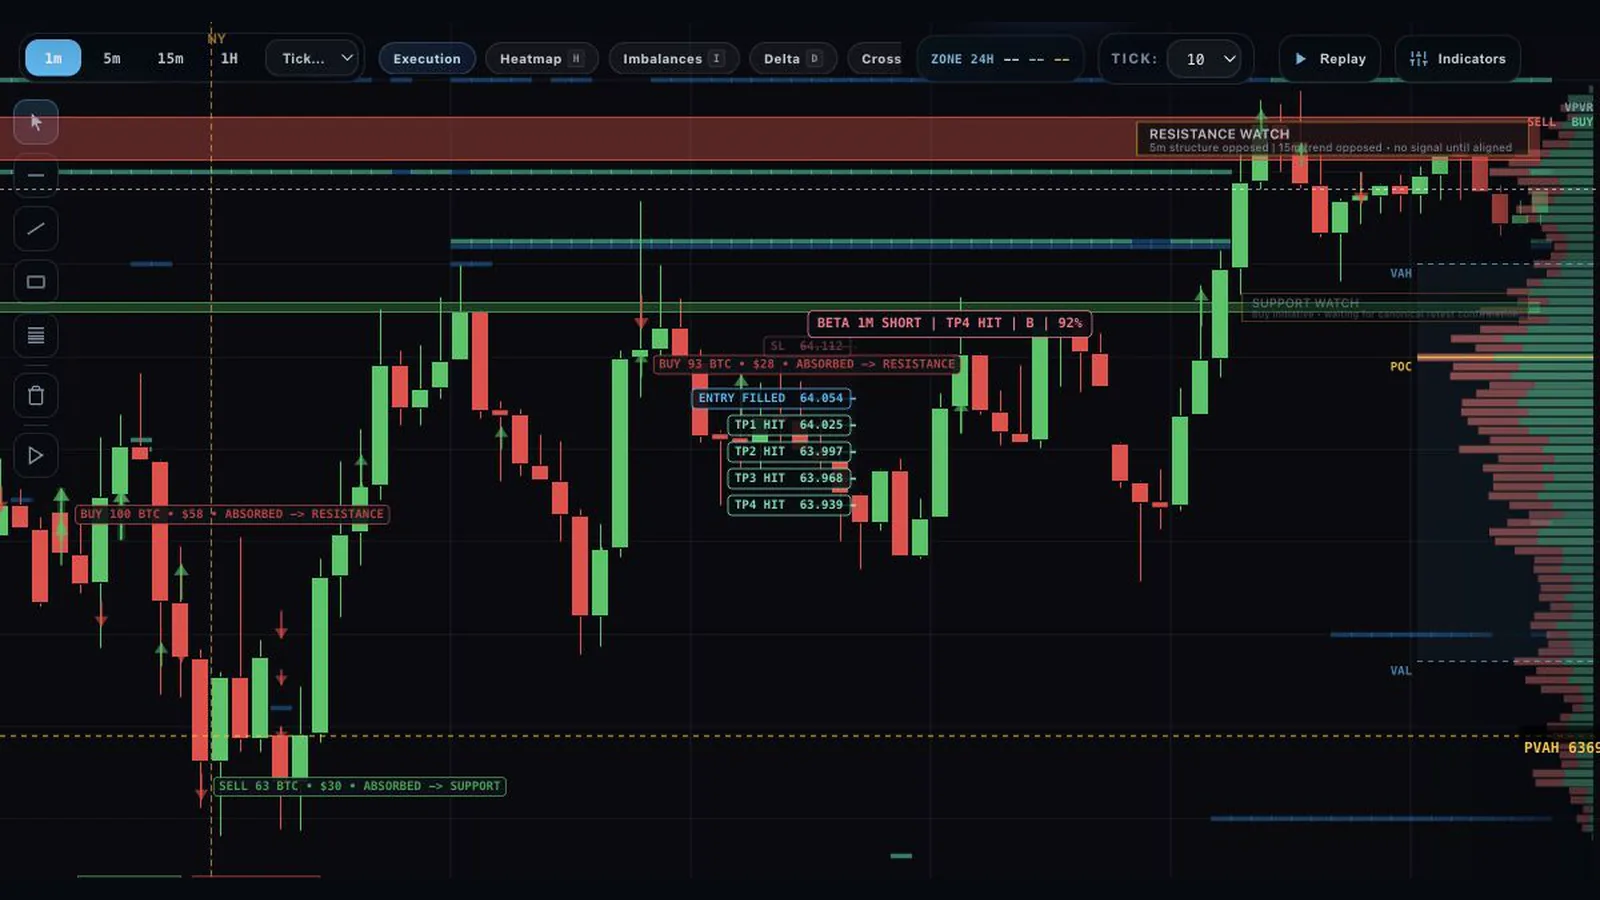
The calculation in plain language
Delta classifies completed trades by which side crossed the spread. It does not measure every buyer versus every seller because every trade always has both.
Positive delta
More volume executed at the ask than at the bid. Buyers were more aggressive because they accepted the available offer instead of waiting with passive bids. Positive delta describes behavior, not guaranteed bullish outcome.
Negative delta
More volume executed at the bid than at the ask. Sellers were more aggressive because they crossed into passive bids. If price refuses to fall despite strongly negative delta, the selling may be absorbed.
Cumulative delta
CVD adds each interval's delta to a running total. Its slope reveals whether net aggressive buying or selling is building across the move, but the starting point and selected data source affect the line.
Four price-flow relationships
The strongest read comes from comparing direction and efficiency, not from labeling every positive value bullish.
Price up, CVD up
Aggressive buying broadly confirms the rise. Continuation is more credible when price also accepts above structure and nearby resting liquidity does not repeatedly absorb the move.
Price down, CVD down
Aggressive selling broadly confirms the decline. The read weakens when large negative delta produces progressively less downside movement or reaches an established support area.
Price up, CVD flat or down
Price is rising without matching net market-buy aggression. This can reflect passive sellers pulling, short covering, or activity outside the measured venue. It is a question, not an automatic short.
Price down, CVD flat or up
Price is falling even though net aggressive selling is not expanding. Buyers may be trapped, bids may be pulling, or the venue may not represent the whole market. Wait for a price reaction.
Divergence versus absorption
They overlap, but they are not the same. Divergence is a relationship between series; absorption is a local execution-versus-price interaction.
Divergence
- Compares price swings with Delta or CVD swings
- Can develop over many candles
- Warns that aggression and price are not aligned
- May exist without a precise defended price
- Needs a trigger or invalidation before action
Absorption
- Focuses on aggressive trades at a specific area
- Requires poor progress or rejection against that flow
- Can create a support or resistance candidate
- Benefits from footprint and liquidity confirmation
- Can be tracked through a zone lifecycle
A practical reading sequence
Use Delta and CVD to ask better questions, then verify the answer at the actual price level.
1. Establish structure
Identify the trend, balance area, profile nodes and nearby support or resistance before interpreting a flow divergence.
2. Compare effort and result
Check whether increasingly aggressive volume produces proportional price progress or begins to stall at a meaningful location.
3. Validate locally
Use the footprint and absorption logic to confirm what happened inside the candle.
FAQ
What is volume delta?
It is ask-side market-buy volume minus bid-side market-sell volume for the chosen interval. It measures which side was more aggressive.
What is cumulative volume delta?
CVD adds each interval's delta over time, making sustained shifts in aggressive execution easier to see than one candle alone.
Does bullish CVD divergence predict a reversal?
No. It signals disagreement between price and measured aggressive flow. Use location, price confirmation and invalidation before treating it as actionable evidence.
Compare aggressive effort with actual price progress.
Open CryptoFlow and read Delta, CVD, footprint and zone behavior as one connected market story.